Import JSON Data into Google Sheets.
Tao RenProblem
Google YouTube API will return a query report by JSON, which has a columnsHeaders to describe the columns and a rows to contain the data table, looks like:
{
 "kind": "youtubeAnalytics#resultTable",
 "columnHeaders": [
  {
   "name": "day",
   "columnType": "DIMENSION",
   "dataType": "STRING"
  },
  {
   "name": "views",
   "columnType": "METRIC",
   "dataType": "INTEGER"
  }
 ],
 "rows": [
  [
   "2017-07-01",
   18552.0
  ],
  [
   "2017-07-02",
   15696.0
  ],
  [
   "2017-07-03",
   21593.0
  ],
  ...
}
Google Analytics API reports the similar way.
How can we import such JSON data into Google Sheets, where we could manipulate the data, e.g. doing calculation, making some charts.
Solution
The most simplest way should be running a customized script1 from Google Spreadsheet’s Tools.
Here’s the detail instructions2:
- Create a new Google Spreadsheet.
- Click on Tools -> Script Editor.
- Click Create script for Spreadsheet.
- Delete the placeholder content and paste the code from the customized script.
- Rename the script to ImportJSON.gs and click the save button.
- Back in the spreadsheet, in a cell, you can type
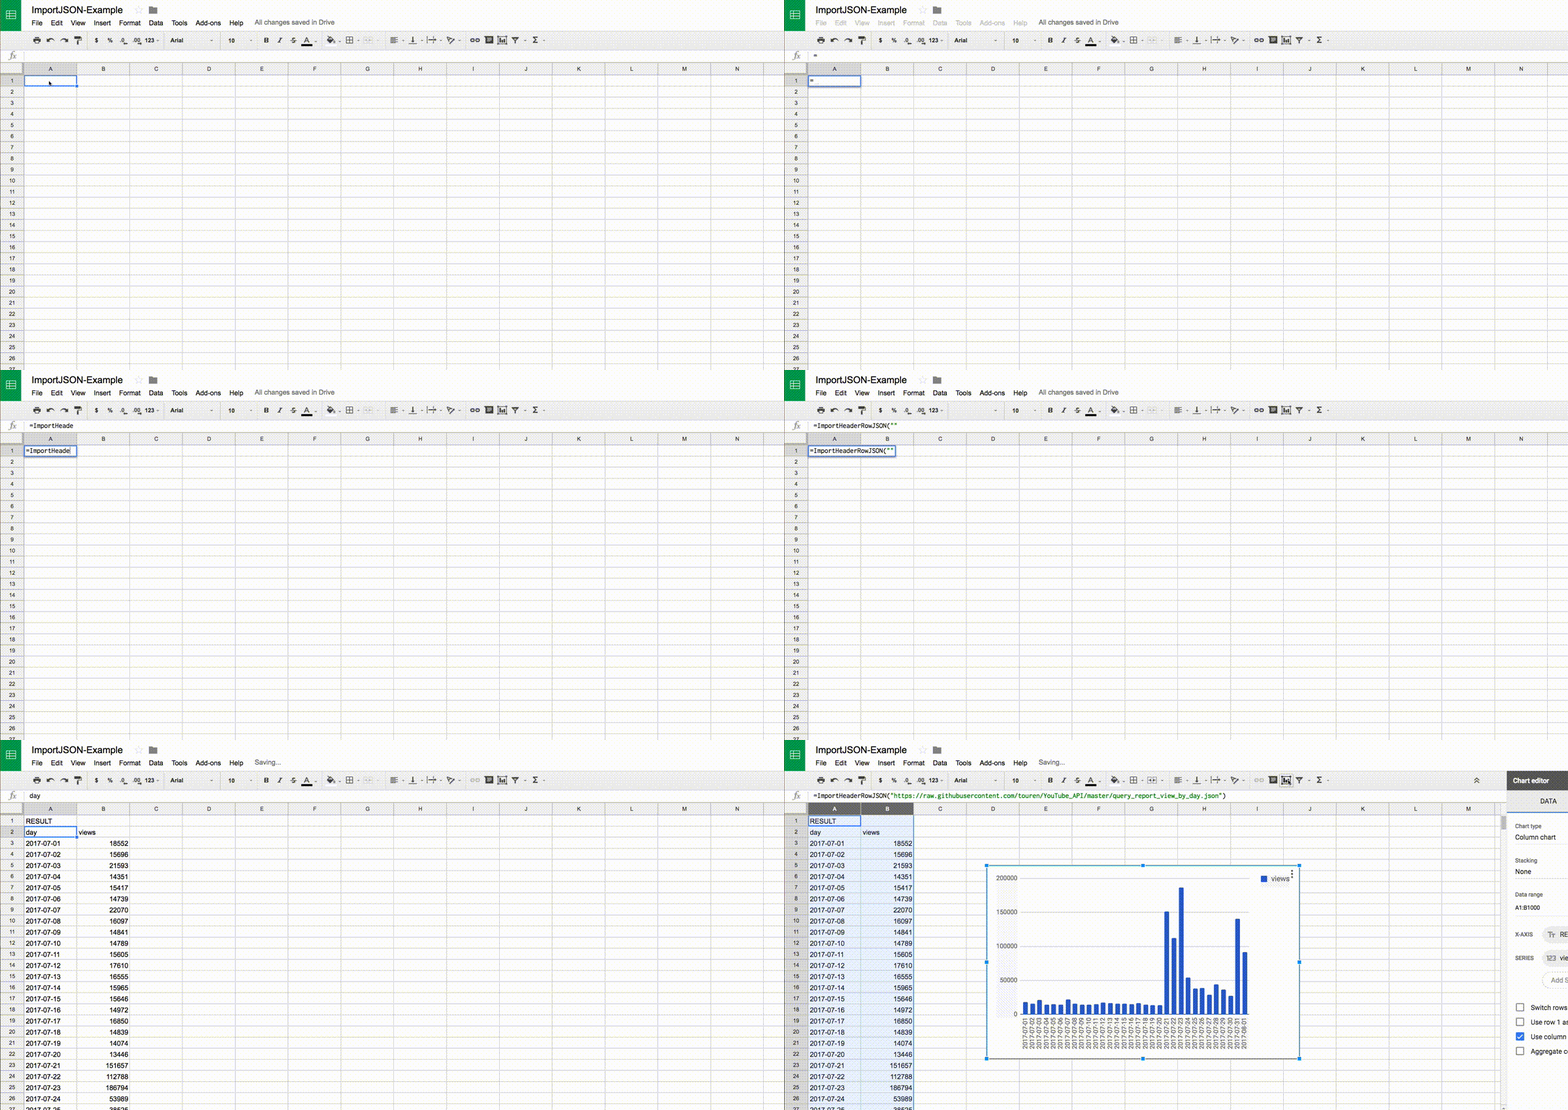
=ImportHeaderRowJSON("https://raw.githubusercontent.com/touren/YouTube_API/master/query_report_view_by_day.json")The script will load the JSON data, parse it, format the columns and create a data table for you.
- You can create a chart on it now.
Below is the demo gif:

- I added a new function ImportHeaderRowJSON, based on the awesome ImportJSON script.
- Referenced from How to import JSON data into Google Spreadsheets in less than 5 minutes.